Crash Course on Cheat Engine
At first glance, Cheat Engine is nothing more than a simple memory scanner; In reality it’s much more. Let’s take a look..
What is it good for?
In my last post I used the term “Dynamic analysis,” which basically just means analysing processes in real-time while they’re running. This is useful because it allows us to find things that would normally be more difficult or even impossible with static analysis. An example would be scanning for your health, taking some damage, then rescanning for the new value. The equivalent with a static analyzer would be finding/identifying the pointer to it in a subroutine that reads/writes your health.
Dynamic vs Static Analysis
There is no right or wrong here. They are both useful in their own regard and you should try to master both. However in certain games one may be more useful than the other. Example: Some games are packed and you will be unable to get any useful information with IDA (they can be unpacked, but that won’t be covered here.) In most cases dynamic analysis would still work because the game is unpacked once running.
Useful Features
In my years of experience with CE here are some of the features I find most useful:
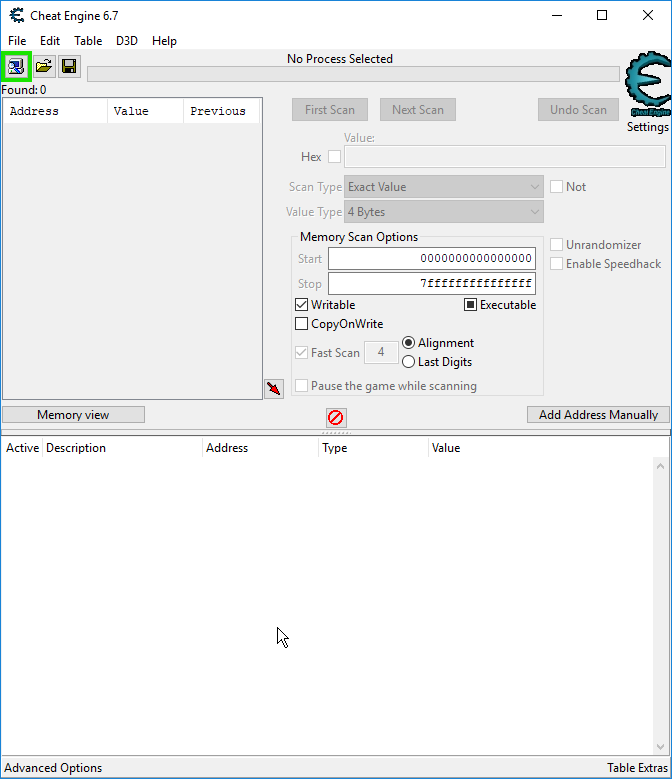
Memory scanning
Many people have used this one before and most believe it is the full extent of the capabilities of cheat engine. While this feature is incredibly useful, the application is capable of much more.
Simply enter a value you wish to search for, the parameters and hit search. To narrow the results further, perform an action in game to get the value to change, and search again. Once you have found the correct result, you may change it to whatever you desire.
You’ll notice every result you find has an “address” associated with it. An address is the memory location that contains the value you see. This is important to us because in the future when we write a standalone cheat, we will write directly to this address instead of scanning.
For more details see the CE tutorial included with CE.
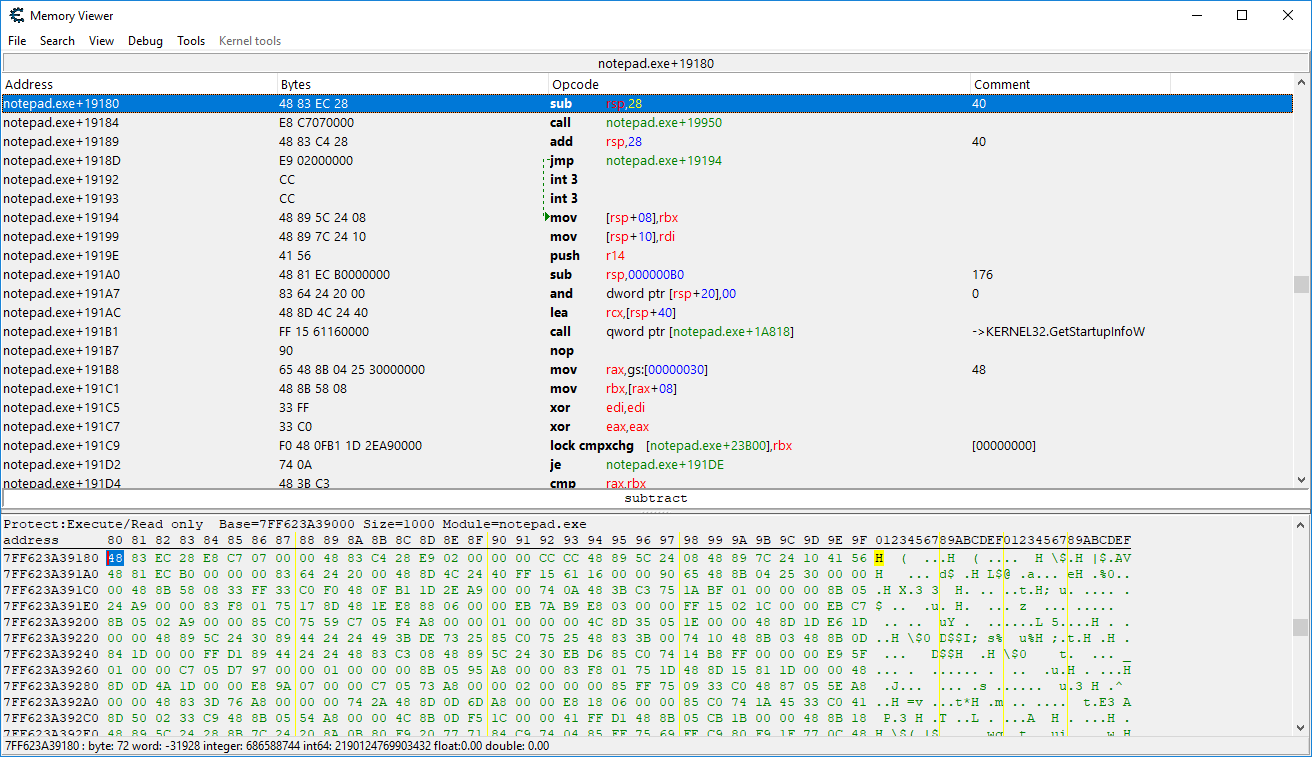
Memory view / Disassembler
Attach CE to a process and hit the memory view button or CTRL-M. If you are blissfully unaware of assembly you will be pretty confused and maybe even a little overwhelmed. The top portion is the disassembler which shows the assembly instructions at a given memory address in the process memory. The bottom counterpart is the hexadecimal view of the bytes at a given adddress.
The CE tutorial will teach you the basics of the disassembler. I recommend reading up on the basics of assembly. Most of our windows PCs run on x86 assembly. Here is a guide for x86 http://www.cs.virginia.edu/~evans/cs216/guides/x86.html
Debugger
If you have programming experience, you know what a debugger is (hopefully!) Since we are debugging the compiled program the debugger steps through individual assembly opcodes rather than the full line of code the developer initially wrote.
Using the debugger we can do many fun things, like tracing code or evaluating/overwriting CPU registers. You may place breakpoints on variables to see which opcodes access said variable.
Auto Assembler / Code Injection
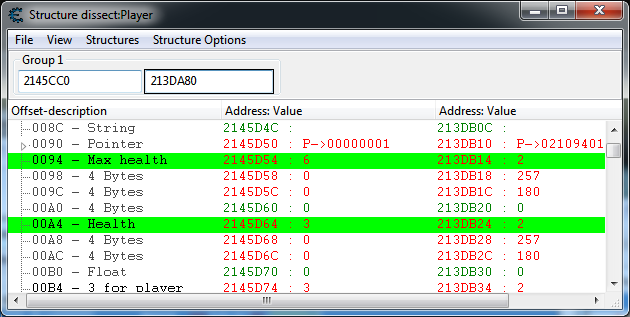
Structure Dissector
I did not use this feature much up until recently, though it is quite handy. With it you can explore memory and identify the memory layout of classes/structures.
Final Thoughts
I’ve only listed a couple of features CE is capable of; There are many more, you just have to explore.
I highly recommend completing the tutorial included with CE before moving on. Understanding what you learn rather than simply memorizing it is important. Know what you’re doing and why and you will be successful.
Next up is a crash course on using IDA.